Ask most coaching institute owners how things are going and you will hear a feeling: “admissions are okay”, “this batch is weak”, “fees are slow this month”. Feelings hide problems until it is too late. A short list of coaching institute KPIs, checked on a fixed routine, turns those feelings into numbers you can act on before a bad month becomes a bad year.
This guide covers ten numbers worth tracking, how to calculate each, how often to look at it and what to do when it moves the wrong way, plus a simple weekly and monthly review routine you can start with a spreadsheet.
Why Coaching Institute KPIs Beat Gut Feeling
A KPI (key performance indicator) is a number that tells you whether an important part of your business is healthy. You need only a handful, covering the student journey: how they find you, whether they join, pay, learn, stay and recommend you.
Three rules make KPIs useful:
- Every KPI needs an owner who collects the number and explains it in the review.
- Every KPI needs a trigger: decide in advance what level means “act now”.
- Compare with yourself first. Your own last month or last season is a better benchmark than any figure you hear from another institute.
The 10 Coaching Institute KPIs Every Owner Should Track
1. Enquiries by Source
What it is: New enquiries in a period, split by source: walk-in, referral, Google, Instagram, WhatsApp, scholarship test, school seminar, pamphlet and so on.
Formula: Count of new enquiries per source.
How often: Weekly in admission season, monthly otherwise.
Action: If a paid source brings few enquiries, cut or change it. If referrals are growing, put more effort behind them. Ask every enquiry “how did you hear about us?” and write it down. For ideas, see our guide on how to increase admissions in a coaching institute.
2. Demo-to-Admission Conversion
What it is: Of the students who attended a demo class, how many took admission.
Formula: Admissions from demo attendees ÷ demo attendees × 100.
How often: Weekly in season.
Action: A low rate usually points to the demo itself, slow follow-up, or a gap between what was promised and shown. Sit in on demos and compare rates by teacher. Our guide on converting a demo class into an admission has a step-by-step approach.
3. Cost per Admission
What it is: Marketing money spent to get one paying student.
Formula: Total marketing spend ÷ admissions in the same period. Also calculate it per channel: channel spend ÷ admissions from that channel.
How often: Monthly, and at the end of each admission season.
Action: Compare it with your average fee per student. For example, if one channel costs a large share of a student’s first-term fee while referrals cost almost nothing, shift budget. Rising cost with flat enquiries usually means a channel is tiring out.
4. Fee Collection Rate and Outstanding Dues
What it is: How much of the fee due has been collected, and how much is pending.
Formula: Fee collected ÷ fee due × 100. Outstanding dues = fee due − fee collected, split by age (under 15 days, 15 to 30 days, over 30 days).
How often: Weekly. Dues grow quietly if nobody looks.
Action: Old dues need a polite personal call, not another automated reminder. If dues pile up in one batch, check whether instalment dates clash with something like a school fee deadline. Our guide to coaching fee management software explains how online payments and reminders help.
5. Attendance Rate
What it is: The share of scheduled classes students actually attended.
Formula: Total attendances ÷ (students enrolled × classes held) × 100, by batch and by student.
How often: Weekly by batch, with a daily glance at absentees.
Action: A student missing two or three classes in a row should get a call. A whole batch dropping often signals a timing problem, a teacher issue or school exams.
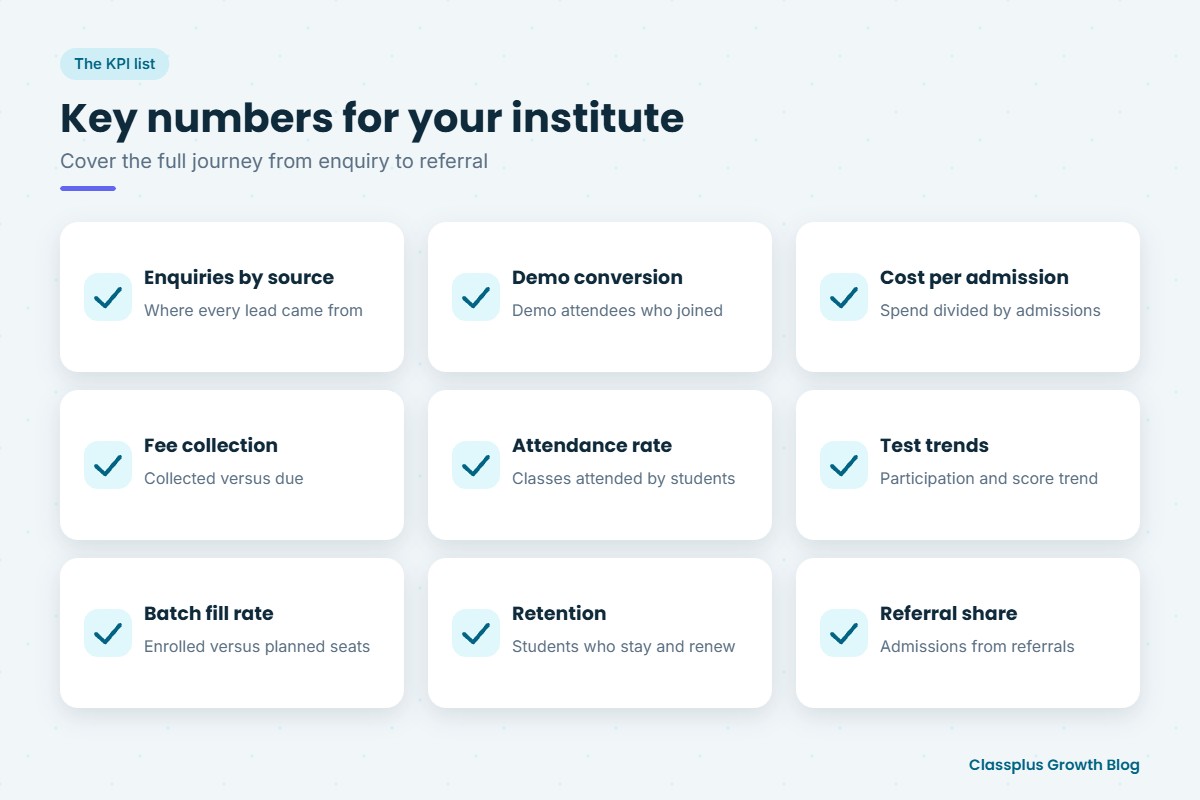
6. Test Participation and Score Trends
What it is: How many students take your tests, and whether scores and topic-wise accuracy improve across the series.
Formula: Participation = test takers ÷ students enrolled × 100. Score trend = this test’s average compared with recent tests of similar difficulty.
How often: After every test, with a monthly trend check.
Action: Low participation is an early warning of disengagement, often before students leave. A falling trend in one topic calls for a remedial class. Flag students who skip tests repeatedly to their teacher or mentor.
7. Batch Fill Rate
What it is: How full each batch is compared with planned capacity.
Formula: Students enrolled ÷ planned seats × 100.
How often: Weekly while admissions are open.
Action: Half-empty batches cost the same teacher hours and rent as full ones. Consider merging, changing timings or targeted marketing. Batches that fill fast may justify a second section. See our guide on batch management for coaching institutes.
8. Student Retention and Renewals
What it is: How many students stay to the end of the course, and how many continue into the next course or year.
Formula: Retention = active at end ÷ active at start × 100. Renewal rate = students who re-enrolled ÷ students eligible × 100.
How often: Monthly for retention; at each renewal window for renewals.
Action: Ask every student who leaves why, and record it. “Too fast”, “timing clash” and “moved to another institute” each need a different fix. Read our guide on student retention strategies for coaching.
9. Teacher-Level Metrics
What it is: A few numbers per teacher: attendance in their classes, their students’ score trends, syllabus completion against plan and demo conversion for demos they took.
Formula: The same formulas, filtered by teacher. Syllabus completion = topics completed ÷ topics planned to date × 100.
How often: Monthly, discussed one-to-one.
Action: These numbers start a conversation, not a judgement. An early-morning batch may simply have lower attendance. Look for patterns over several months and pair struggling teachers with strong ones.
10. Referral Share
What it is: The share of new admissions that came from referrals by students or parents.
Formula: Referral admissions ÷ total admissions × 100.
How often: Monthly and at season end.
Action: A low share may point to the student experience rather than the referral offer. If it is growing, make referring easier with a simple reward. See our guide on a referral programme for your coaching institute.
KPI Summary Table
Keep this at the top of your review sheet.
| KPI | Check | Act when |
|---|---|---|
| Enquiries by source | Weekly in season | A paid source brings few enquiries |
| Demo-to-admission conversion | Weekly in season | Rate drops or differs sharply by teacher |
| Cost per admission | Monthly | Rises while enquiries stay flat |
| Fee collection rate | Weekly | Dues older than 30 days grow |
| Attendance rate | Weekly | Consecutive absences or a batch dip |
| Test participation and scores | After each test | Participation falls or a topic keeps dropping |
| Batch fill rate | Weekly while admissions open | Well below capacity near start date |
| Retention and renewals | Monthly | Dropouts cluster in one batch or reason |
| Teacher-level metrics | Monthly | A pattern persists for months |
| Referral share | Monthly | Share falls season on season |
A Simple Weekly and Monthly Review Routine
Numbers only help if someone looks at them on a fixed day.
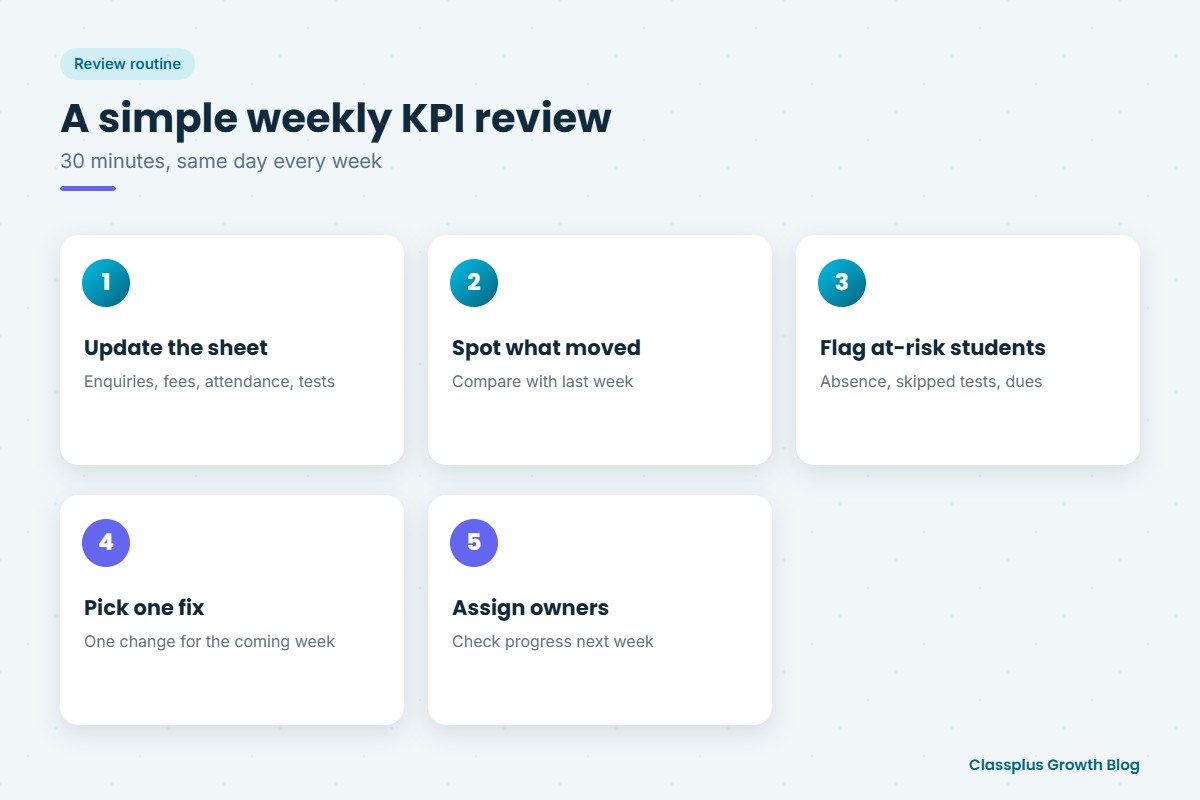
Weekly Review (30 Minutes)
- Update the sheet: enquiries by source, demos, admissions, fees, attendance, test participation.
- Look only at what moved compared with last week.
- Pick the students most at risk (absence, skipped tests, overdue fees) and assign someone to call each.
- Choose one fix for the coming week, such as faster demo follow-up.
- Note who owns each action and check it next week.
Monthly Review (One to Two Hours)
- Review trends: cost per admission, retention, referral share, score trends.
- Review each batch: fill rate, attendance, syllabus completion, test results.
- Hold short one-to-ones with teachers using their numbers as a starting point.
- Adjust next month’s budget using cost per admission by channel.
- Note one thing to stop, one to start and one to continue.
At the end of each season, compare KPIs with the previous season. That comparison becomes the starting point for next year’s plan. Keep definitions fixed: decide once what counts as an “enquiry” or “admission”, or comparisons become meaningless.
How Classplus Helps You Track the Numbers
Much of this data is easier to collect when classes, tests and fees run in one place. With Classplus, you get your own branded app and website where you can run live classes and recorded courses, conduct online tests and test series with test performance tracking, collect fees online with coupons, manage batches and attendance, and send notifications to students. Classplus also offers marketing assistance to help you plan your outreach.
To see how this could support your weekly review, book a free demo with Classplus.
Conclusion
You do not need complex software or a data team to manage by numbers. Pick the coaching institute KPIs that matter most, define each clearly, give it an owner and look at it on the same day every week. Within a few months, the numbers will show where admissions leak, where fees get stuck and which students need help, and your decisions will rest on facts rather than feelings.
Frequently Asked Questions
What are the most important KPIs for a coaching institute?
The most useful ones cover the full student journey: enquiries by source, demo-to-admission conversion, cost per admission, fee collection, attendance, test participation and scores, batch fill rate, retention, teacher-level metrics and referral share. If ten feels like too many, start with enquiries, conversion, fees, attendance and retention.
How do I calculate cost per admission?
Divide total marketing spend in a period by the admissions in the same period. For a clearer picture, calculate it for each channel by dividing that channel’s spend by the admissions it brought in.
How often should I review coaching institute KPIs?
Review fast-moving numbers such as enquiries, fees, attendance and demo conversion weekly, especially in admission season. Review retention, cost per admission, referral share and teacher-level metrics monthly, with a fuller comparison at the end of each season.
What is a good demo-to-admission conversion rate?
There is no single correct figure because it depends on your segment, fee level and city. The best benchmark is your own past performance, so track it every season and by teacher and focus on steady improvement.
Should I share KPIs with my teachers?
Yes, as a tool for improvement rather than blame. Discuss teacher-level numbers one-to-one, look at patterns over several months and involve teachers in deciding what to change. Public ranking of teachers usually does more harm than good.
Can I track KPIs without special software?
Yes. A spreadsheet with one tab per KPI and a fixed weekly review day is enough to start. As you grow, tools that bring classes, tests, attendance and fees into one place reduce the manual work of collecting data.